I don't know why I hadn't taken the time to do this before, but I just invested 5 minutes into SQL Profiler to make my life much easier when debugging stored procedures.
When I'm faced with stored procedure debugging, especially procedures that take awhile to run, or require a series of steps in the application to fire off, I often use SQL Profiler to capture the SQL call. Then I'll re-run the call directly in SQL Management Studio. But SQL Profiler can bring back a lot of noise, making it tough to grab only what I need.
I finally created a custom trace template and set it to be my default. It will only show me stored procedure calls made from my local workstation to the development database. (we have a shared development database*)
I stumbled a little bit while setting this up, so I thought I'd share my settings. First, start with the default, standard trace template by clicking to start a new trace. Hitting the Events Selection tab allows you to customize the trace.
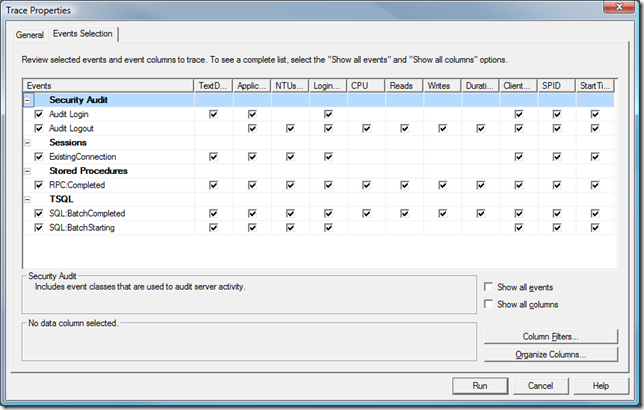
Since I'm always dealing with stored procedures (on my current project), I want to limit the events down to those. I want to be self-centered and only see events that originated from my workstation, and only for the development database.
- Turn on Show all events
- Turn on Show all columns
- Uncheck all events except Stored Procedures: RPC:Completed and RPC:Starting
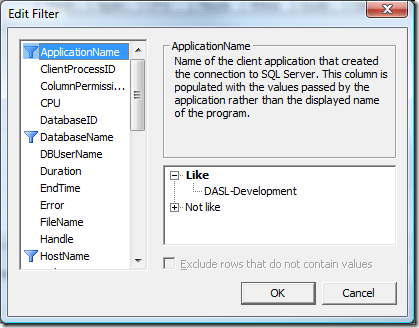
- Click on Column Filters
- Set a rule for ApplicationName Like [application name]
- This value is set within your connection string. In my case, it's "DASL-Development."
- Set a rule for DatabaseName Like [database name]
- Set a rule for HostName Like [your workstation name]
- Click OK
Then you can click Run to start your trace. Click around in your application to make sure you're seeing what you expect. If so, the next step is to save this as a template, then we'll make it the default.
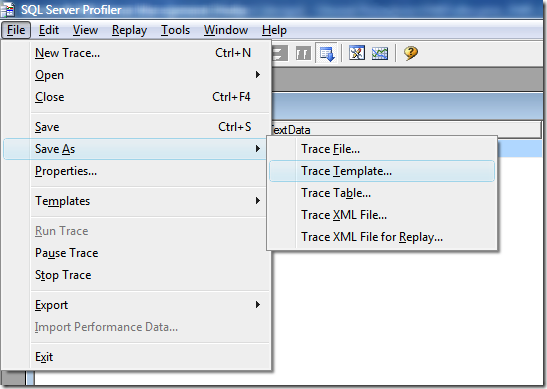
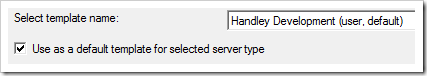
I named my template "Handley Development." There is one step left to make this the default template. This is where I had to dig to find the setting. It's not under Tools->Options like I expected. Instead, it's under File->Templates->Edit Template...
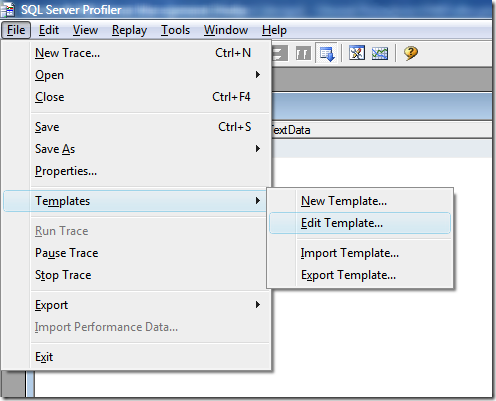
This brings up a dialog to edit any of your templates. Select your new template from the dropdown and then check the box for 'Use as a default template for selected server type.' Hit Save, and you're good to go!
Next time you start a new trace, this template will be selected by default. The signal to noise ratio will be much better and you can quickly get the stored procedure call that you need.
* There’s no need to tell me that we shouldn’t be using a shared development database. In our environment, with 60GB databases and such, the shared database works out much better than local ones.